The CPRC hired McLaughlin & Associates to survey 1,000 general election voters on December 17th, 2024, regarding whether they carry concealed handguns. Not surprisingly, people in constitutional-carry states carry concealed handguns more frequently than people in right-to-carry states. While there is no difference in the rate that people carry all or most of the time in right-to-carry versus the seven states that were may-issue before Bruen, there is a large difference in the total number of general election voters who carry at least once in a while.
.
While this survey doesn’t ask people if they are legally carrying, given that this is limited to people who voted in the general election, presumably they are at least somewhat more law-abiding than the general population. We will do a later survey that breaks down whether people are legally carrying.
.
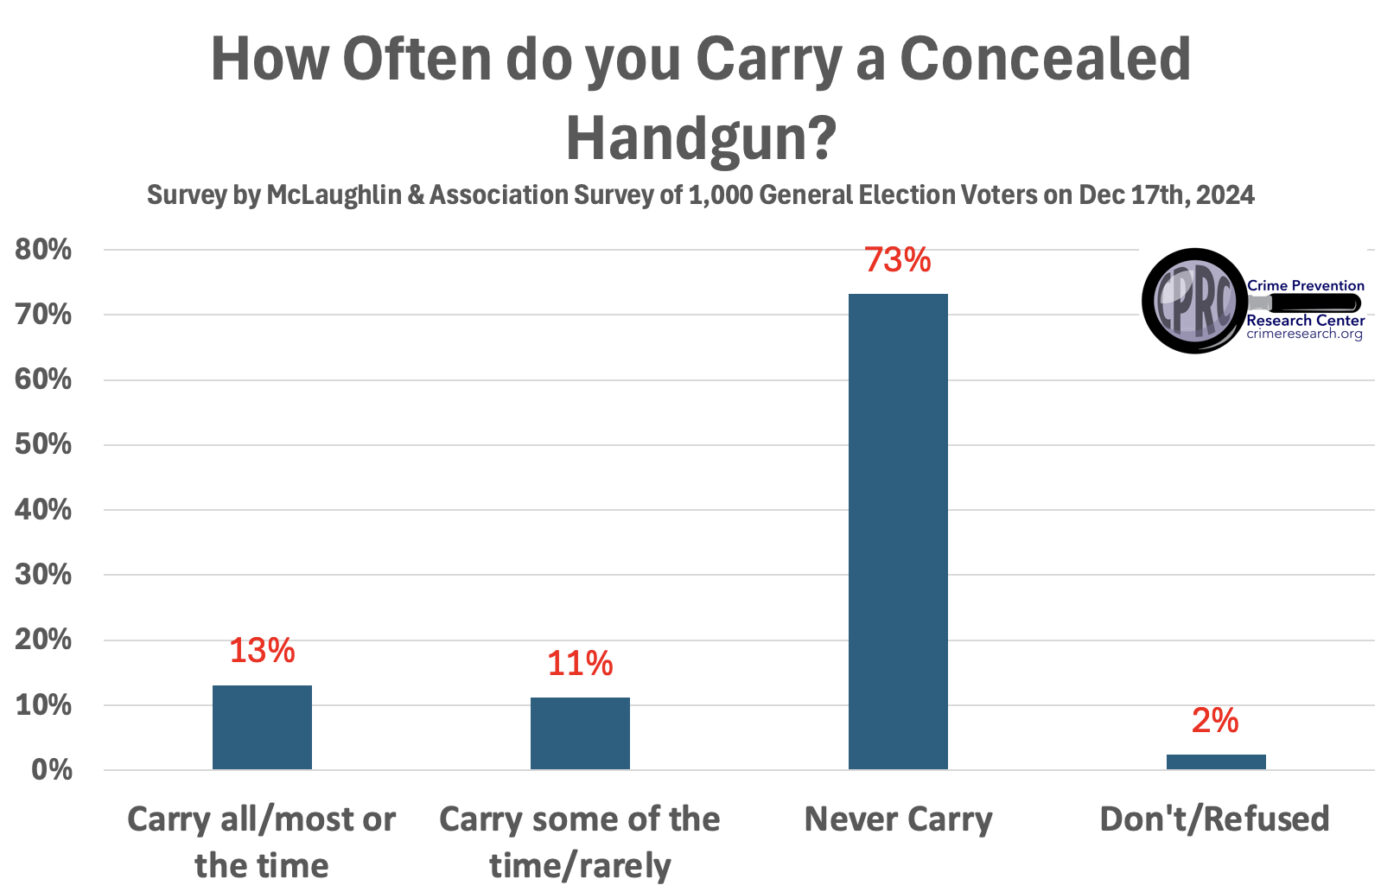
Overall, 24% of general election voters say they carry concealed handguns, with 13% who carry all or most of the time.

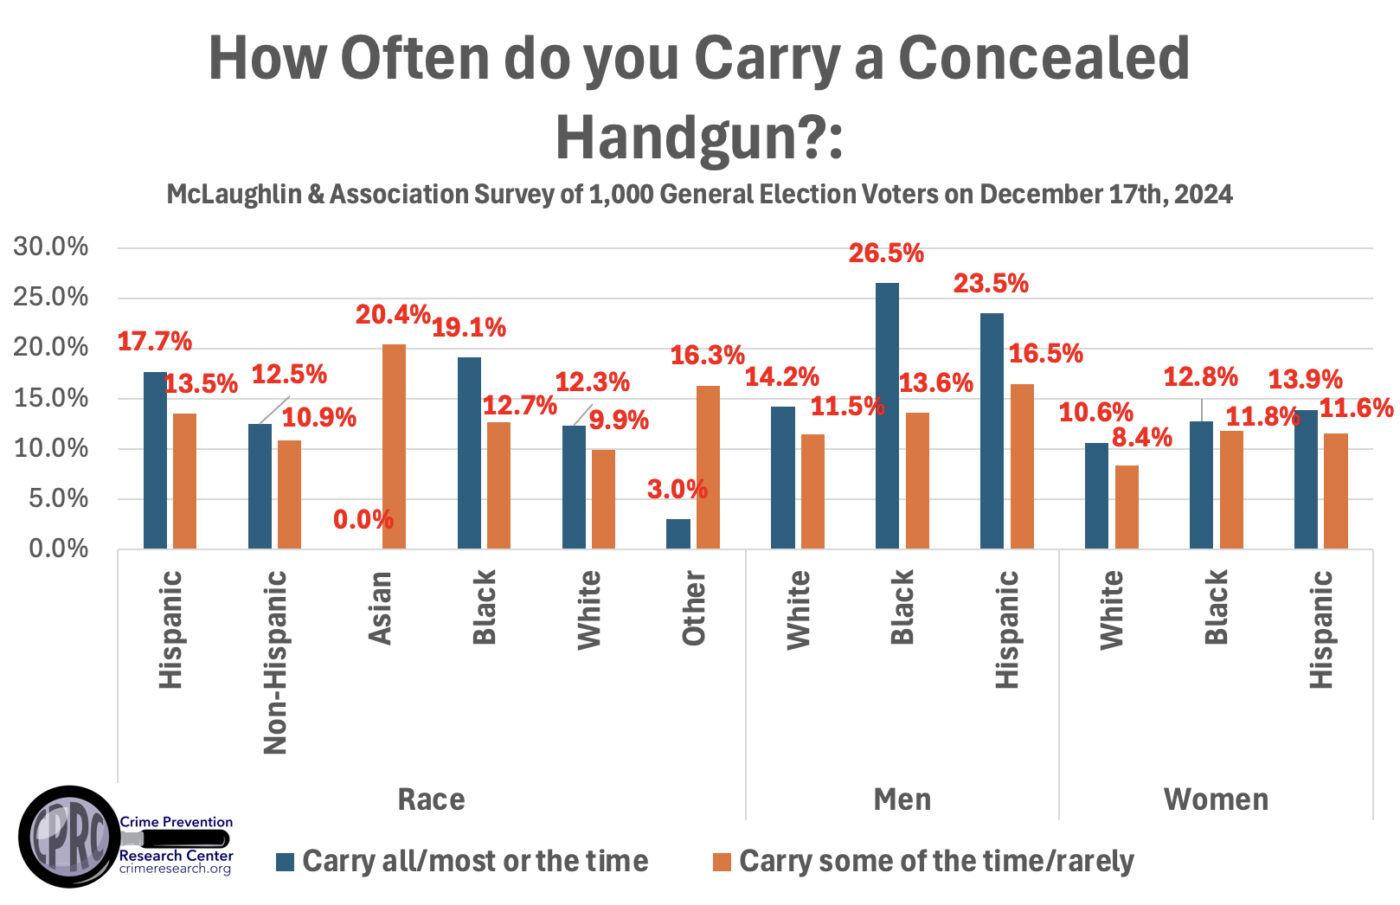
Hispanics and blacks are much more likely to carry concealed handguns than whites. That is true for both men and women. This is particularly important and understandable given that blacks are the most likely victims of violent crime.

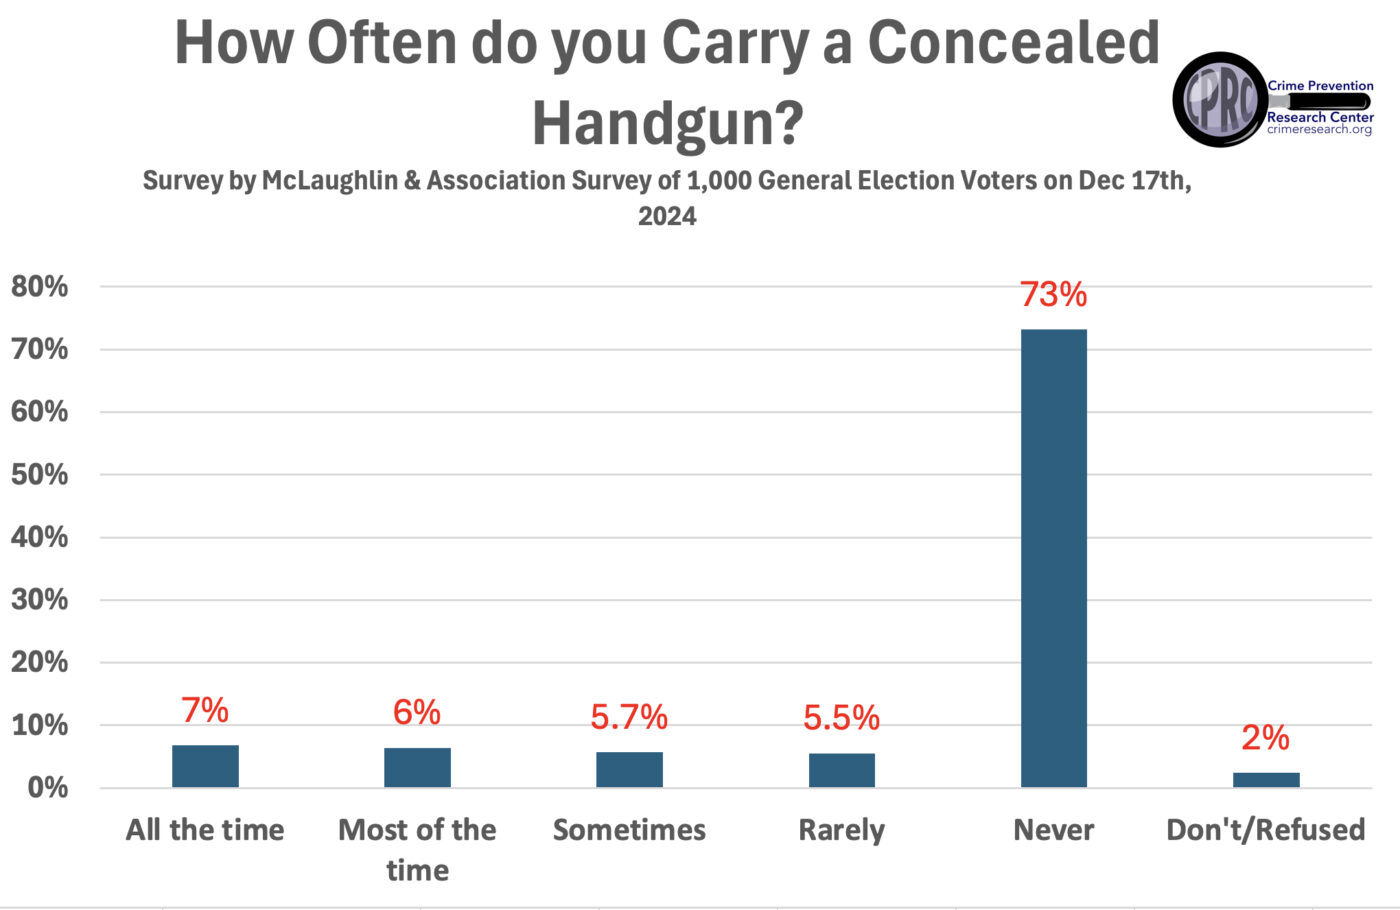
A further breakdown of the rate that people carry is shown here, with 7% carrying all the time and 6% most of the time.

People in the South are the most likely to carry, and followed closely by the west and then the midwest. Republicans and conservatives are the most likely to carry, though even significant numbers of liberals carry. Urban and rural general election voters carry at the highest rates.


